Fun With Options: The Basics (Part 2)
Last week, I introduced Options. Today will be the second and final lesson on Option Basics.
Once we understand these fundamentals, we can move onto the fun stuff like
How to Amplify Returns with Options?
How to Insure Your Portfolio with Options?
How Options can reduce Your Taxes?
Let’s get started.
Profit Curves For Call Options
It is helpful to visualize what a Call would be worth at expiration depending on where the price of the underlying stock ends up.
Imagine you can purchase a Call Option with a strike of $40 for $1.5 (i.e $150). Then its Profits and Loss graph (at expiration) will look like the below.

Image Source: Fidelity.com
Key Takeaway: Fixed Downside, Unlimited Upside
Buying Call Options have a known risk (price you pay to buy them) and have unlimited upside. They increase in value as the stock price increases. They decrease in value as the stock price decreases.
Let’s walk through the different scenarios at expiration:
Case 1: Stock ends up below $40 at expiration
This will result in a 100% loss of $1.50 (the price paid for the option) :=(
Recall $40 is the strike price
Case 2: Stock ends up between $40 and $41.50 at expiration
This will also result in a loss, equal to the Stock Price minus $40 minus $1.50 :=(
Note: $41.50 is the breakeven price (Strike Price plus Price Paid to buy the call).
Case 3: Stock ends up above $41.50 at expiration
If the stock is higher than $41.50, we will have a profit. The higher the price, the higher the profit :=)
Recall, you can also sell options.
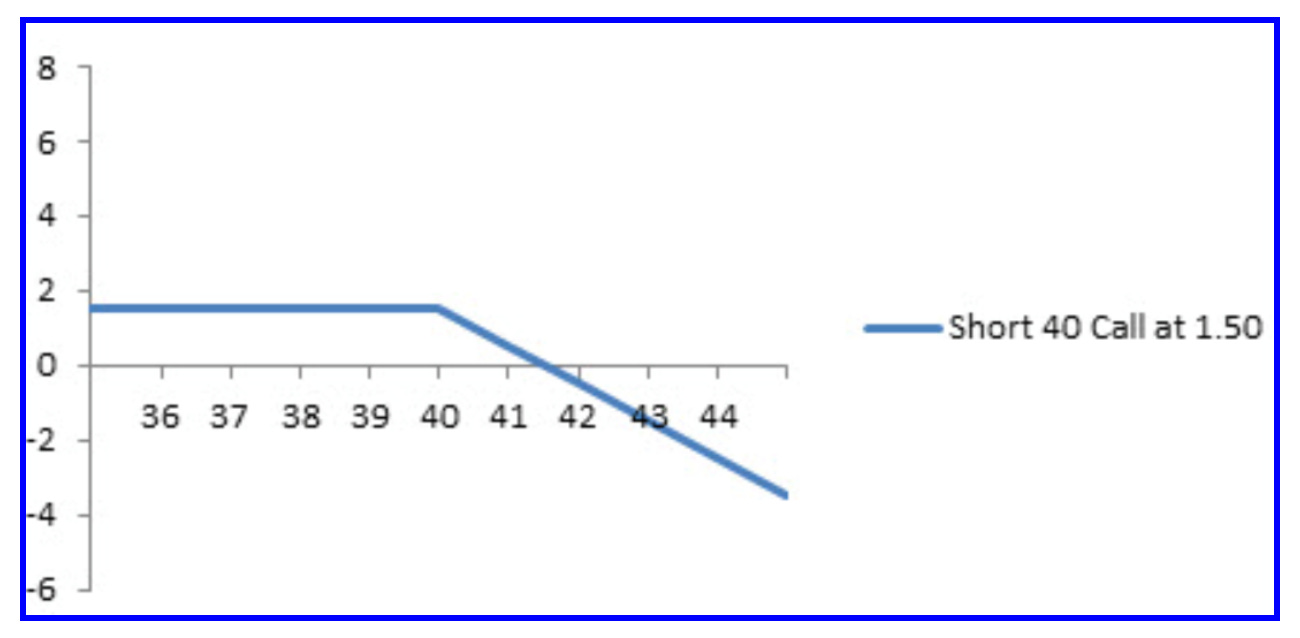
Imagine that instead of buying the above Call option, you had sold it. Then its Profits and Loss graph (at expiration) will look like the below (a mirror image of the above).

Key Takeaway: (Warning!!) Fixed upside, Unlimited Downside
Selling Call Options have an unlimited/unknown risk and a defined upside. They increase in value as the stock price decreases. They decrease in value as the stock price increases.
Let’s walk through the different scenarios at expiration:
Case 1: Stock ends up below $40 at expiration
Best Case Scenario: This will result in a maximum profit of $1.50 (the amount received upfront from the sale of the option) :=)
Case 2: Stock ends up between $40 and $41.50 at expiration
This will also result in a profit, equal to $40 plus $1.50 minus Stock Price :=)
Case 3: Stock ends up above $41.50 at expiration
In this case, we will have a loss, equal to Stock Price minus Strike Price ($40) minus option sale price ($1.50). :=(
Caution: Note that this loss could be unlimited! As a result, selling calls can be very dangerous!
Profit Curves For Put Options
Let’s generalize and talk about Puts now.
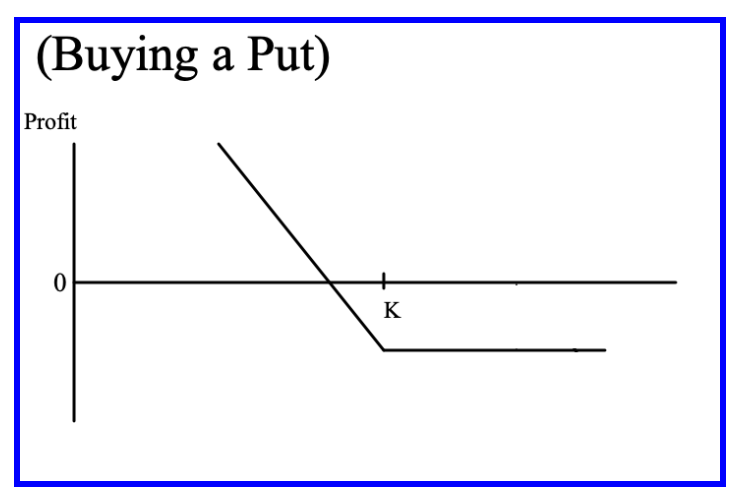
Lets visualize what a Put would be worth at expiration, assuming a strike price of $K.

Key Takeaway: Fixed downside, Significant Upside
Buying Put Options have a known risk (price you pay to buy them) and have unlimited upside (max profit if a stock goes to $0). They increase in value as the stock price decreases. They decrease in value as the stock price increases.
Let’s walk through the different scenarios at expiration:
Case 1: Stock ends up above $K at expiration
Then the Put will be worthless at expiration so you would have a 100% loss :=(
Case 2: Stock ends up between $K and the Breakeven Price at expiration
The breakeven stock price is the Strike Price (K) minus Amount Received for the put. That means the breakeven price is lower than $K. In this case, the Put will result in a loss :=(
Case 3: Stock ends up below the Breakeven Price at expiration
In this case, we could have a profit :=)
Now, let’s look at the Profit & Loss graph (at expiration) for Selling a Put with strike K.

Key Takeaways: Fixed upside, Significant Downside
Selling Put Options have a fixed upside potential but significant downside (max loss if a stock goes to $0). They decrease in value as the stock price decreases. They increase in value as the stock price increases.
Let’s walk through the different scenarios at expiration:
Case 1: Stock ends up above $K at expiration
Then the Put will give us the maximum profit (i.e the Price we sold the Put at) :=)
Case 2: Stock ends up between $K and the Breakeven Price at expiration
The breakeven stock price is the Strike Price (K) minus Price Paid for the put. That means the breakeven price is lower than $K. In this case, the Put will result in a profit :=)
Case 3: Stock ends up below the Breakeven Price at expiration
In this case, we would have a loss :=(
The maximum loss would occur if the stock goes to $0.
Conclusion
After reading the above (and Part 1), you should now understand the basic mechanics of calls and puts. (If you have questions, feel free to email me).
When used carefully and thoughtfully, options have the potential to be quite a useful part of our investment tool belt.
Next, we can finally get to the fun part: “Hacking Options: Amplifying Returns using Options”
Subscribe to Receive My First Option Hack
See you next week!
